Online dashboard shows why districts need fully funded schools

Education Minnesota has launched a new online platform to show a snapshot of what fully funding schools might mean in our school districts.
The web-based platform allows educators, staff, families, community members and legislators to see how a school district fares in the funding of certain categories.
The goal is to show the clear need for fully funding education using key data points that affect teaching and learning conditions in a school district.
The areas highlighted on the dashboard are only a few issues we must address to start the long process of building schools worthy of all students, regardless of race or address. This does not show everything a district needs to be fully funded.
The dashboard also serves as a way for the public to interact with our full funding campaign. Users will be asked to share the dashboard on their social media channels, as well as sign Education Minnesota’s petition asking lawmakers to fully fund schools and contact their legislators about these issues.
The dashboard will be a part of an advertising campaign Education Minnesota launched this spring to educate and inform the public around the need for fully funding education.
How do we use the dashboard?
Go to www.believeinwemn.com/dashboard/. You will enter in the school district number or city that you want to view. Then you will go through three values-based questions to hopefully root the user in why these data points are important to student success.
The questions are:
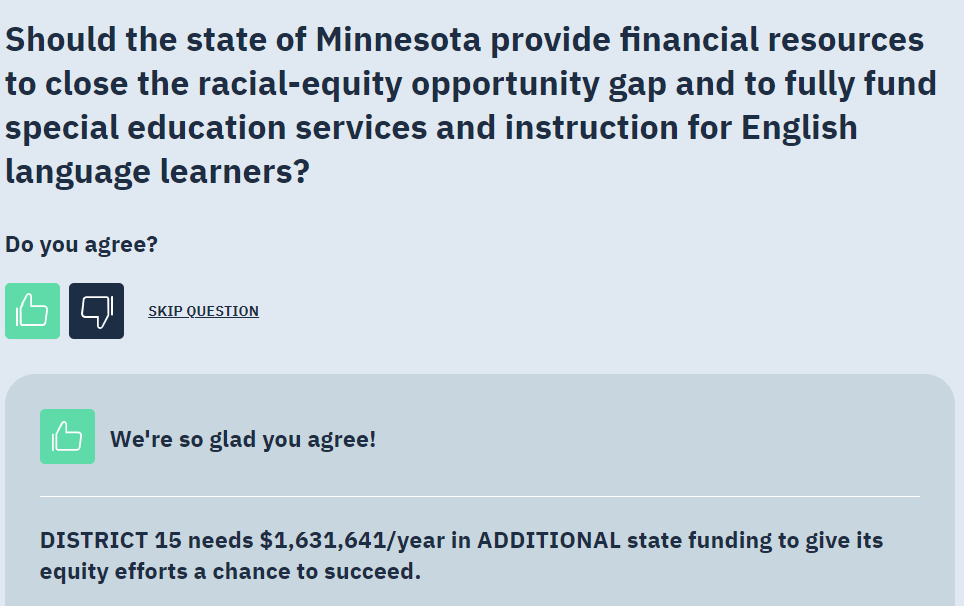
Should the state of Minnesota provide financial resources to close the racial-equity opportunity gap and to fully fund special education services and instruction for English language learners?
Should schools provide the nurses, counselors, psychologists and social workers that our students need to get timely help?
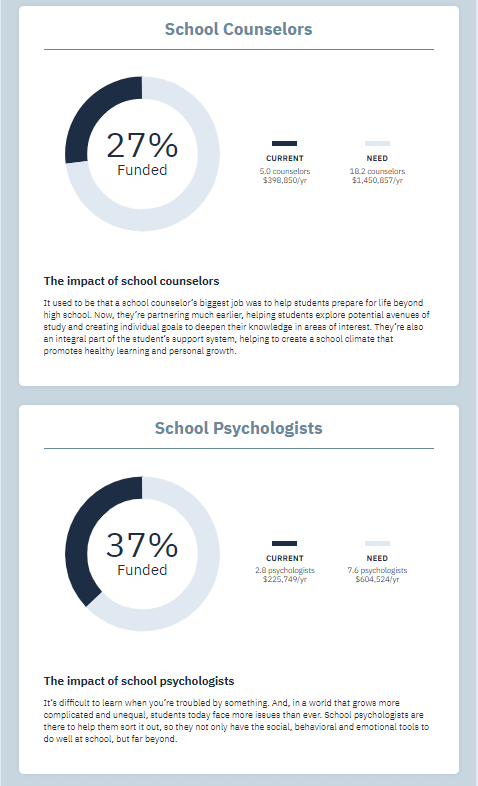
Question two
The second question on the dashboard focuses on student support staff — licensed school nurses, counselors, psychologists and social workers. Districts are able to see how many staff they need to meet the recommended staffing levels by the national associations of those educators, and how much funding that would take.
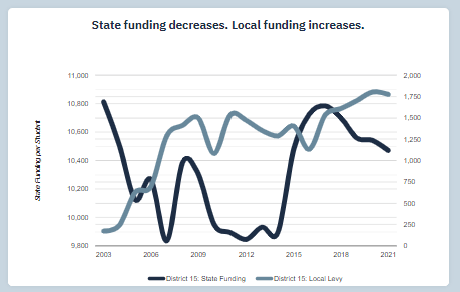
Should school funding in Minnesota be equitable and sufficient across the whole state, so that all students — no matter what they look like or where they come from — have what they need to succeed?
Users will see how much funding their district needs in that category to meet the suggested threshold, such as fully funding special education services, meeting the national ratios for support services staff or showing how much local levies have had to cover costs.
Each category also includes a description of why these areas of funding are important to creating an equitable and successful school community.
At the end, the user will get a final “report” card summary of the total dollar amounts needed to fully fund each issue.
Why are there only a few areas?
These are the data points that Education Minnesota and the state can track for the 300+ regular school districts and charter schools. These are issue that are accessible statewide.
Unfortunately, we are not able to provide the data from intermediate districts, co-ops and ed districts because of their limitations around levying for funding and some of their specific funding categories.
These are also the data points where we can show a direct dollar amount to resolve the underfunding.
How did we get/calculate this data?
We have gathered this data from both internal and external sources:
For question one on the racial-equity opportunity gap and fully funding special education services and instruction for English language learners: This data comes from the Minnesota Department of Education. It was generated in response to proposals from the State Funding Task Force around racial equity and special education. The EL data is MDE data on the EL “cross-subsidy” comparing spending vs. revenue on students who are English learners. These are amounts directly provided and calculated by MDE.
For question two on the staffing of licensed nurses, counselors, psychologists and social workers: Education Minnesota used MDE data on the numbers of staff in each district in each position and figure out the ratio of students to nurses, for example. We figured out what FTE would be needed if districts had sufficient staff to meet the ratios recommended by the professional associations, such as the National Association of School Nurses, for example, and then we figure out what the gap is. A total cost is determined to make up the gap by multiplying the number of staff needed by a per-FTE cost number that is generated by looking at the average salary reported for licensed teachers with an additional 30 percent benefit premium.
For question three on the funding levels and inflation adjustments: This is based on MDE data and the calculations are done by an economist with expertise in school finance, Jeff VanWychen. He has worked for the state and now is a consultant. The data takes MDE’s per-pupil aid and levy amounts from the most recent forecast and does an inflation-adjustment to determine their value in 2003 dollars. The trend is then shown in per-pupil amounts, which is often talked about as the per-pupil spending power.